
Understanding the Impact of Revenue Growth Management (RGM) on Sales Performance
In today’s competitive business landscape, maximizing sales performance is crucial for sustainable growth and success. Revenue Growth Management encompasses various techniques and strategies to optimize pricing, promotions, assortment, and trade spending.
It involves analyzing market dynamics, customer behavior, and internal data to identify opportunities for improving sales performance. Overall, businesses can make informed decisions to enhance their revenue generation capabilities by leveraging data-driven insights.
But the thing is that we all know this already, as the impact of Revenue Growth Management practices on sales performance cannot be overstated. By implementing best yet situation-wise RGM practices, organizations can align their sales strategies with market demands more effectively. But how do you do this exactly? Let’s dive in.
Identifying the Sales Performance Gap
After receiving an alert from the Copilot, we know that we have a sales performance issue. If you are not yet familiar with Revenue.AI’s platform, then you are probably wondering what this Copilot is we are talking about.
Copilot is your cognitive AI-driven intelligence that you can use via your favorite messenger, such as Teams, WhatsApp, or Telegram – options are endless.
After subscribing to a specific alert or a KPI you are tracking, you will receive notifications to take relevant next steps for mitigating the risk you have been informed about. For example, a chosen KPI could be sales, profit, etc. It could be any KPI of your choice, and any granularity such as category, channel, brand even product. In this case, we’ll use it to mitigate sales performance risks.
We can then go to the dashboard integrated into RAI’s platform to see the details from the chat, or we can ask our Copilot more questions. Using the Copilot in the chat is very similar to chatting with ChatGPT, the difference is that this Copilot can answer your RGM-specific questions.
Investigating Sales Performance & Deep Dive into Sales Variance
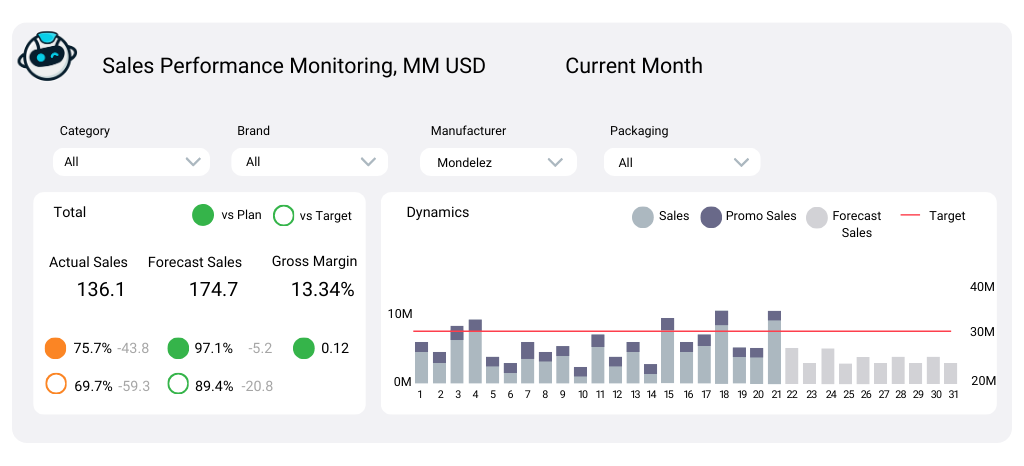
For investigating the sales performance, as a first step, we usually use a sales performance dashboard, where we track daily sales performance and compare it with monthly targets and forecasts. A possible addition is to have order tracking on the dashboard, as it’s helpful information for managing orders and identifying sales gaps.
If we know that there are multiple potential sources where the loss could be coming from:
- Low sales volume performance
- Inefficient pricing strategies
- Promo performance issue
- Revenue drainer mix
Then we need to find out where our loss is coming from.
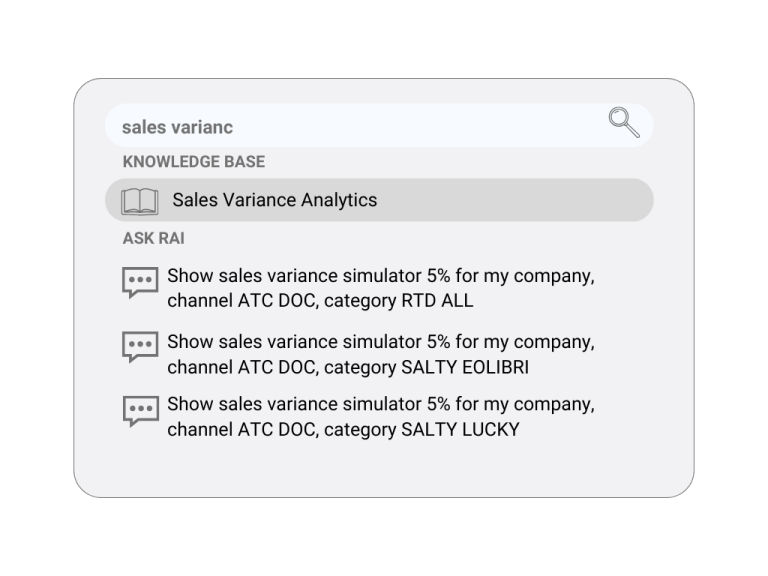
To review further, and investigate sales performance further, we’ll review the sales variance as well, by simply using the Google-like search bar, and the Copilot will take us there in a matter of seconds:
We can see the sales variance now, and understand better where the gap in sales performance is coming from, as shown below in the illustrative visual:
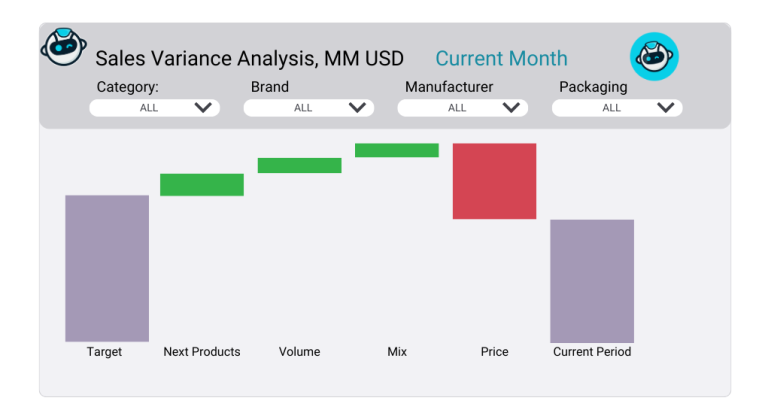
We can now observe the difference between the target and actual sales for the two selected periods, and that we have a price issue that leads to sales loss in the selected category for alert. However, this is not enough information yet for decision-making about how we’ll mitigate this sales performance risk. We need to deep-dive to understand the reasons.
Deep Dive Sales & Pricing Performance Review
To identify which channels in the dark chocolate category are causing the sales performance drop, we’ll review a detailed analysis of prices. We need the help of our Copilot to retrieve the high-level diagnostics for the dark chocolate category.
Now, how can reviewing the hypermarket channels’ price trends be helpful? Well, we can identify where the pricing gap is coming from. It can happen that, even though we did a price increase in the hypermarket channel, we are selling at a low price point compared to competitors.
We can see how important this is, as conducting a thorough competitive analysis is essential for developing successful pricing strategies. Understanding how competitors are positioning themselves in the market and what prices they are offering allows businesses to differentiate themselves and offer unique value propositions that attract customers.
Now, what do we do with this information? We need to see which price is the best option for us by leveraging price corridors. Using them, we can observe which products are high performers in the category (hint: it is dark chocolate) and channel (hint: it is hypermarket).
Mitigating the Sales Performance Gap
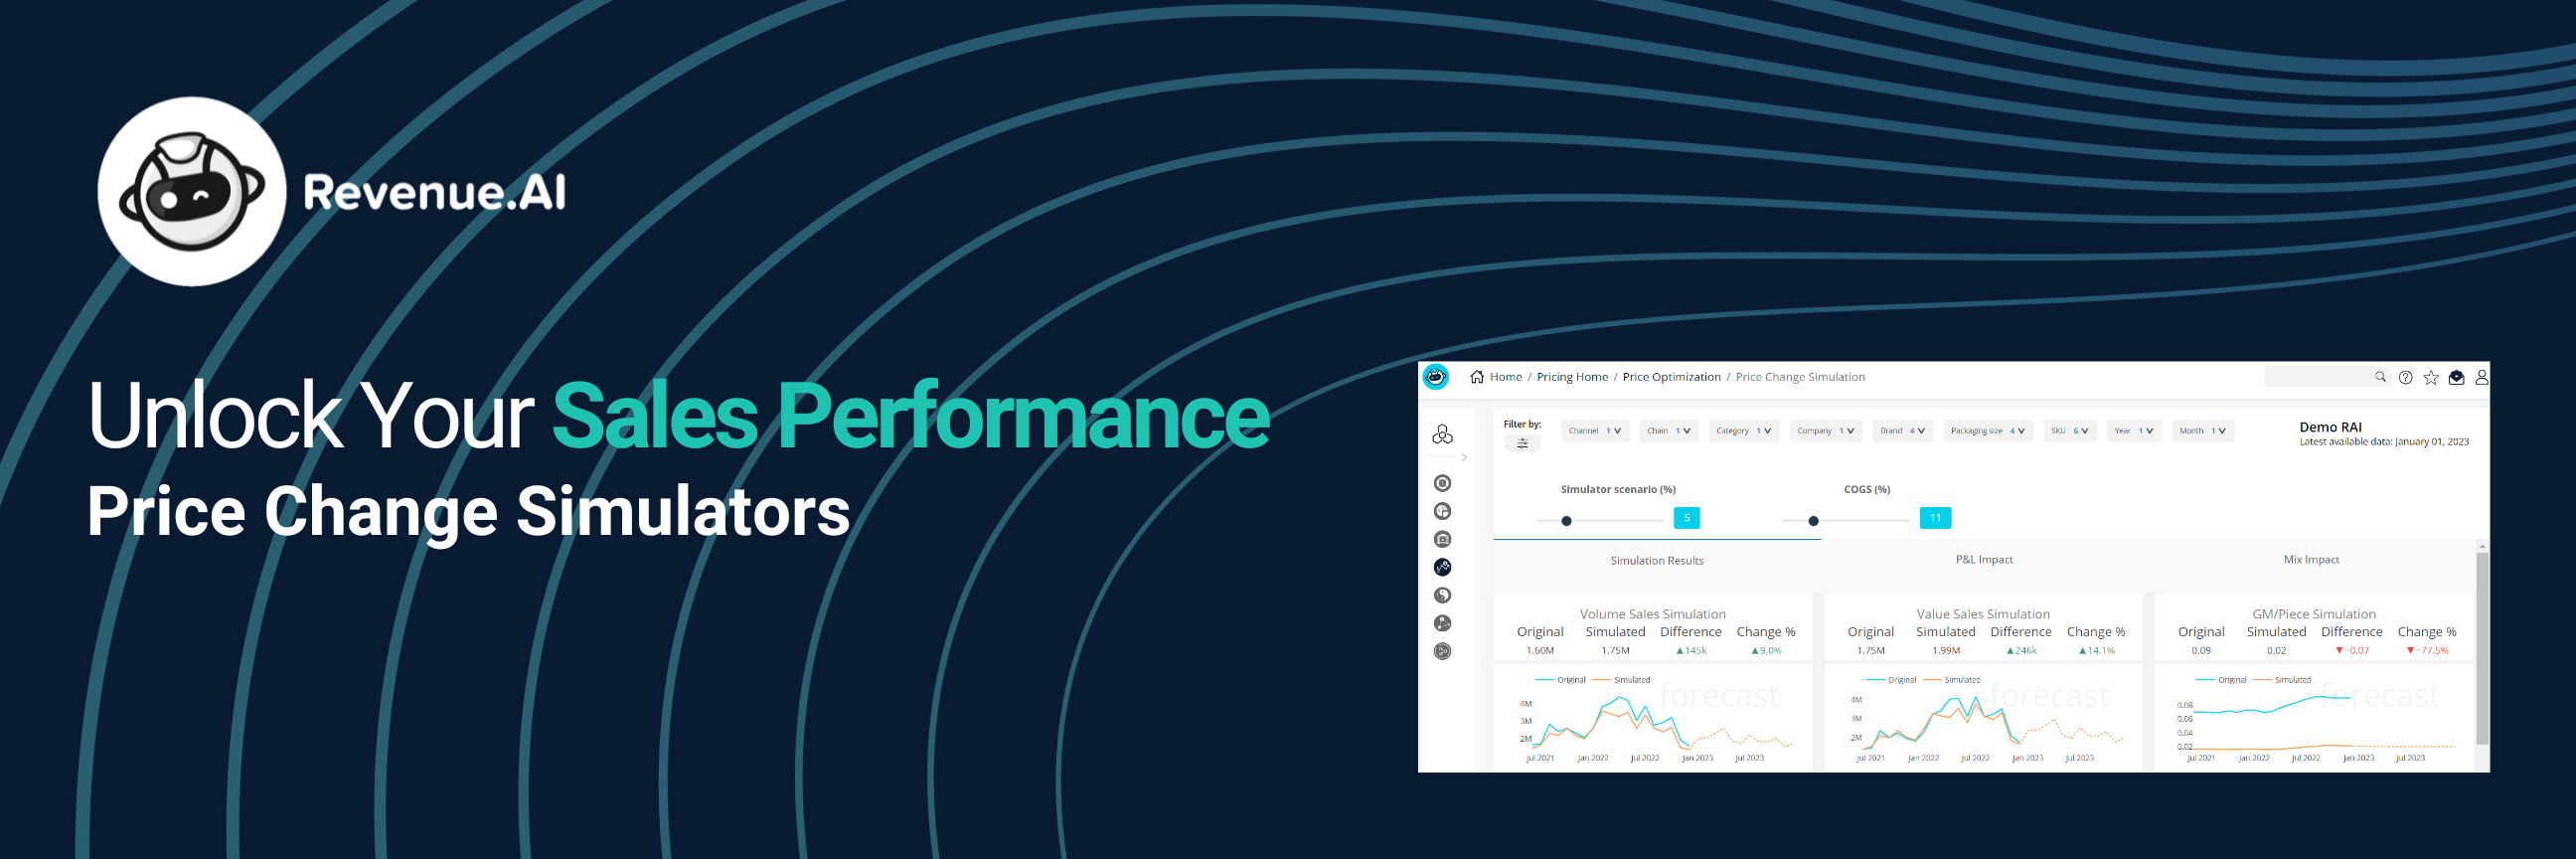
What are Price Change Simulators
Price change simulators using price corridors enable businesses to analyze and predict the impact of different pricing scenarios on their bottom line.
Price corridors help you define these price limits of your product’s tier within your category in comparison with the competition. By setting upper and lower boundaries within which prices can fluctuate, companies can optimize their pricing strategies based on market trends and consumer behavior.
These simulators take into account various factors such as demand elasticity, competitor prices, and customer preferences to provide accurate simulations. They allow businesses to test different scenarios and assess potential outcomes before implementing any changes in their pricing structure.
But don’t worry, we won’t dive into endless calculations or statistical formulas now. We have a powerful tool that does this for you, and we’ll show you how to leverage it for increasing sales performance.
However, if you’re an Excel power user and you’d like to try this for yourself first, you can take a look at this article for detailed instructions. Or, if you’d like to take the reading further, this would be a good resource to do so.
Leveraging Price Corridors Analytics
The Price Corridor Analytical Tool provides its users with an automated analysis flow and insights to support retail price strategy settings via the simple one-page web interface.
Sounds too complicated? Let’s simplify this a bit.
We’ll as always go to our Copilot, as we know what we are looking for, so we need to get there quickly, which the Copilot will do for us, by simply typing “price corridor dark hyper”.
Our aim is to find out what is the maximal price point that we can set, that is still competitive on the market, and won’t result in us losing volume share, or essentially impacting sales performance negatively.
First, we will review the benchmarks, as visible below:
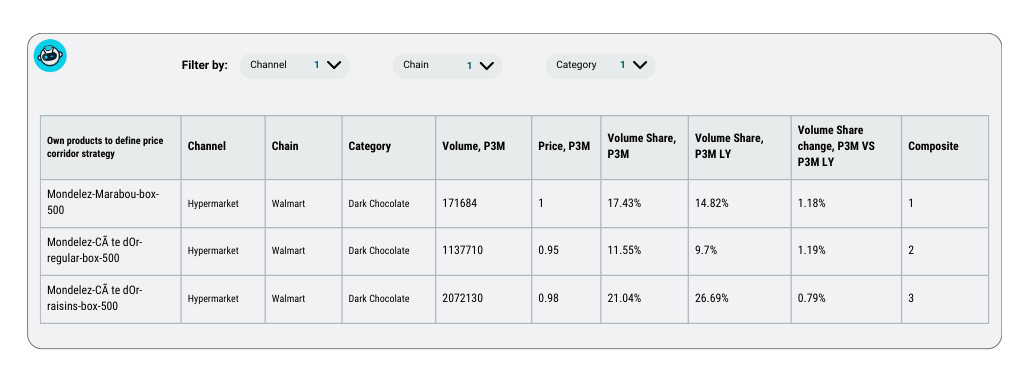
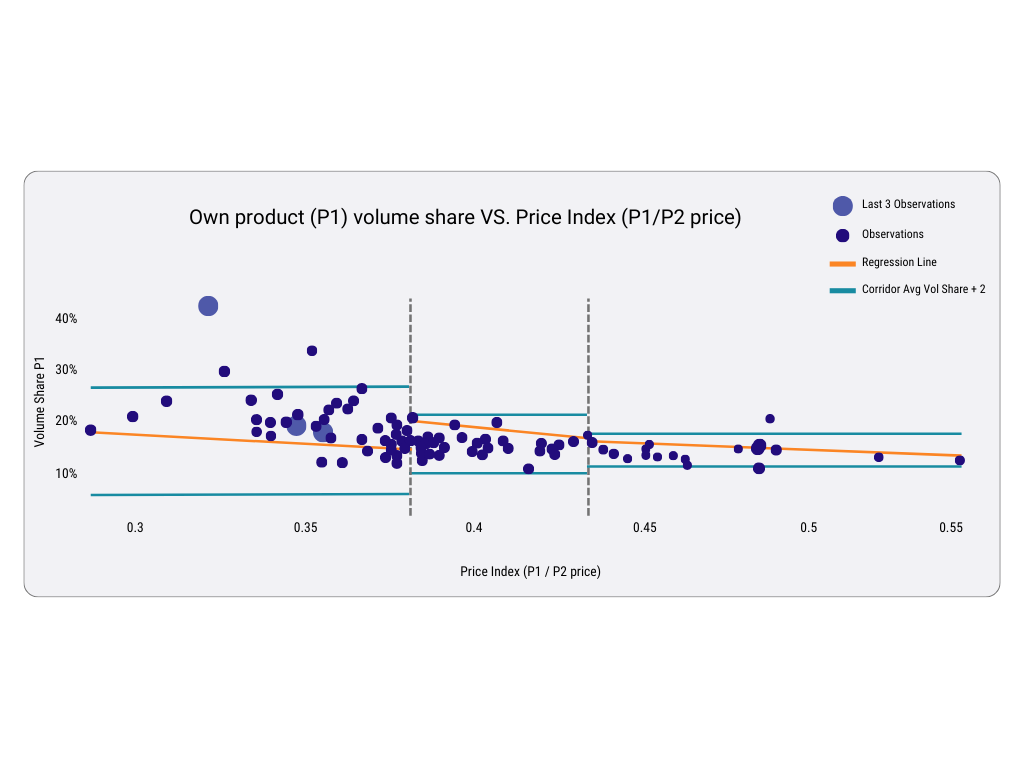
Based on these benchmarks, we can identify opportunities to increase prices. We will use the corridor to analyze how much we can increase (see the arrow that shows possibilities, lower and upper limit below):
Just a note that that are many more charts available on the platform, but we wanted to highlight only the problem-relevant graphs, so as not to overwhelm you too much. But, if you’re curious, you can scroll through this article, as we showcase how our data apps are built and how you can build them, too.
What is also neat is that, in case you are not familiar with pricing corridors, or any other RGM-related strategy, we’ve got detailed playbooks available, that you can always refer to, and learn at your own pace.
Now, as we understand how flexible we can be with the price, we can go and play with simulations, and check their impact on various KPIs, including sales performance.
Unlocking Insights with the Pricing Simulator
We’re now going to simulate various pricing scenarios and assess the potential outcomes before implementing any changes. In under one minute, you can simulate many products’ price changes and plan future prices on the results of these simulations. This not only saves time but also minimizes the risks associated with price adjustments.
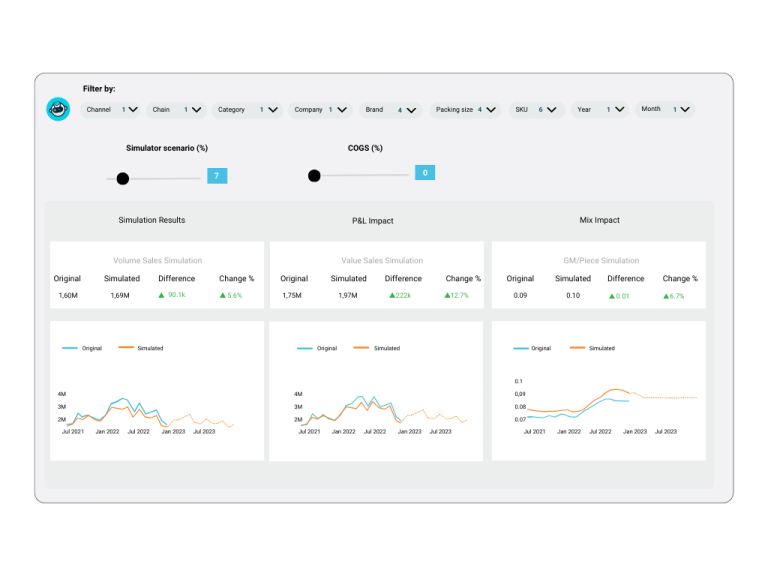
Here is what it looks like in practice. After alternating between different % increases, and stop at a 7% price increase, and keeping COGS at 0%, we will have a positive impact on revenue.
Check out the simulation below.
We can also see where we’ve got opportunities on the market:
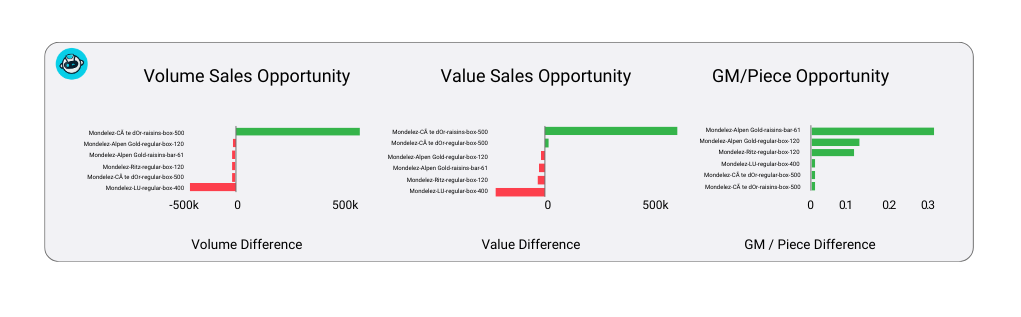
With these opportunities, we can also identify the products for which we want to increase prices and vice versa. We can also check the mix impact (which is the last page of the simulator).
In case the image is tiny for you on the mobile phone, on the left part of the charts you will see product names, and, on the right, we have volume difference.
All our KPIs turned green now, and there is positive volume sales and value sales, and GM per piece opportunity, we’ve reached a final decision on what the increase will be. We can now bookmark this analysis and share it with the team, for easy implementation, and sales performance tracking.
You can learn more about this solution here as well. If you’re more curious about accelerating the dynamic profitable mix management from local to global, then check out the details of the solution here.
Boosting Sales Performance with Effective Pricing Strategies
Dynamic pricing is revolutionizing industries across the board. With price change simulators using price corridors, businesses can stay ahead of the curve by adapting their prices in real time according to market conditions. This not only helps maximize revenue but also ensures that customers perceive value in their purchases.
By utilizing these tools effectively, businesses can fine-tune their pricing strategies and make data-driven decisions that align with their sales performance, and ultimately financial goals. Price change simulators using price corridors provide valuable insights into how changing prices within certain boundaries can impact profitability and customer satisfaction.
By leveraging data-driven insights and staying abreast of market trends, you can optimize your prices for maximum profitability while satisfying your customers’ demands for value.
Incorporate our powerful price change simulators using price corridors into your business strategy and take control of your pricing decisions today.